Launching a product is fantastic fun, but the work doesn’t end there. Once you start to build up a considerable amount of content and gain more users interacting with your system you will need to be on the lookout for areas of poor performance. In this blog post I will explain some of the code-level tools and techniques we use to identify & improve the performance of BOS.
There is a large amount of documentation, blogs and online videos with helpful advice on how to improve your django website, however each application and architecture is different, so you really need to soak it all in first and then decide what will work best for you. For instance you might have a site with mostly static content which can be easily cached or you might need to move your static files to a CDN, or look into database pooling. Once you resolve the low hanging fruit, everything else takes time and this is one area where having a very comprehensive test suite is really useful as it will quickly tell you if you’ve inadvertently added a regression somewhere.
Some of the following advice can be using during development, and for this the best tool is the django-debug-toolbar which is an awesome utility for quickly identifying performance problems. However once your site is launched you really need tools to monitor your infrastructure and log files so that you can quickly identify which conditions lead to performance problems. Once you gain an understanding of your typical usage profile you can then start to tackle issues and demonstrate improvements.
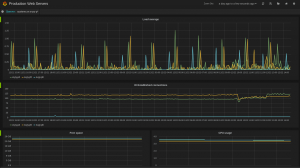
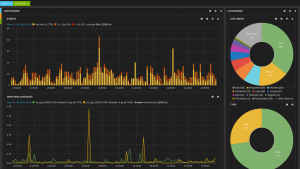
Elasticsearch/Kibana log analysis screenshot
In this post I will not be considering general hardware or infrastructure issues but instead focus on what can be done at the code-level. As a general rule, problems are likely to fall in one of the following areas.
Too many database queries
This has been a particular problem with the BOS application. Our surveys are represented as hierarchically-structured database-backed objects and it’s often the case that an update to one element of a survey impacts on many others; e.g. adding a new question is likely to fire off a cascade of additional updates: updating the parent question, regenerating question numbers, updating page routing, invalidating caches etc). Django certainly doesn’t help by making it all too easy to generate additional database queries by mistake – e.g. calling question.survey.id will instantiate a new survey object requiring many db calls but you can get the id of the survey for free using question.survey_id
During development we often found that just rendering the edit page for a survey was generating many hundreds of queries. Our solution to the problem was to add a caching layer on the survey object to store all questions as a local dictionary and then add unit tests to our codebase which locked down the number of queries a given page was expected to use. These tests would immediately fail if one of the developers inadvertently wrote code which queried the database rather than using our cache.
from django.db import connection, reset_queries
from django.core.cache import cache

@override_settings(DEBUG=True)
def test_query_performance_on_render_page(self):
    """ Tests that rendering the first page of a survey uses exactly 4 queries. """

    # Reset the queries and cache in case anything happened in a setUp() method
    reset_queries()
    cache.clear()

    # Call the page under test
    self.client.get('/example-survey')

    # Check our expected number of queries
    self.assertEquals(len(connection.queries), 4)
Speed of database queries
Identifying particularly slow queries during development is difficult because you often need a lot of content and a good usage profile to help spot the poorly performing queries. One of the advantages of rewriting an application is that you already know where the pain points are and re-architecting the system gives you a chance to solve them. For BOS v2 we’ve known that the analysis of surveys is the most database intensive aspect of the site and to try and overcome this we use a NoSQL backend for storing the responses to surveys. We also use additional indexes to reduce the need for complex queries.
One approach we’ve considered (but not yet implemented) is using a solution like Celery for asynchronous task processing. This would let us offload particularly expensive queries or jobs to a background thread, freeing up the front end to deal with more requests. Examples where this might be useful would be bulk email sending, priming caches or generating charts for the analysis section.
Poorly written code
Poorly written code can often be very difficult to identify during development partly because code changes so frequently but also problems might only arise in production under specific conditions or once you have a sufficiently large set of data to process. I recently identified just such a piece of code which regenerated the question numbers for a survey. In trying to work out why the rending of a large survey took so long, I quickly realised that the recursive nature of the number generation code created over 380k method calls during a single request – and because the resulting data wasn’t being cached anywhere this meant the code was regenerating question numbers every time it was being called! You can use simple print statements and time.time() calls to help you spot problems, however a better solution is to use cprofile and the django-profiling middleware which can profile your code and give you a snapshot of all the calls made during a single page request.
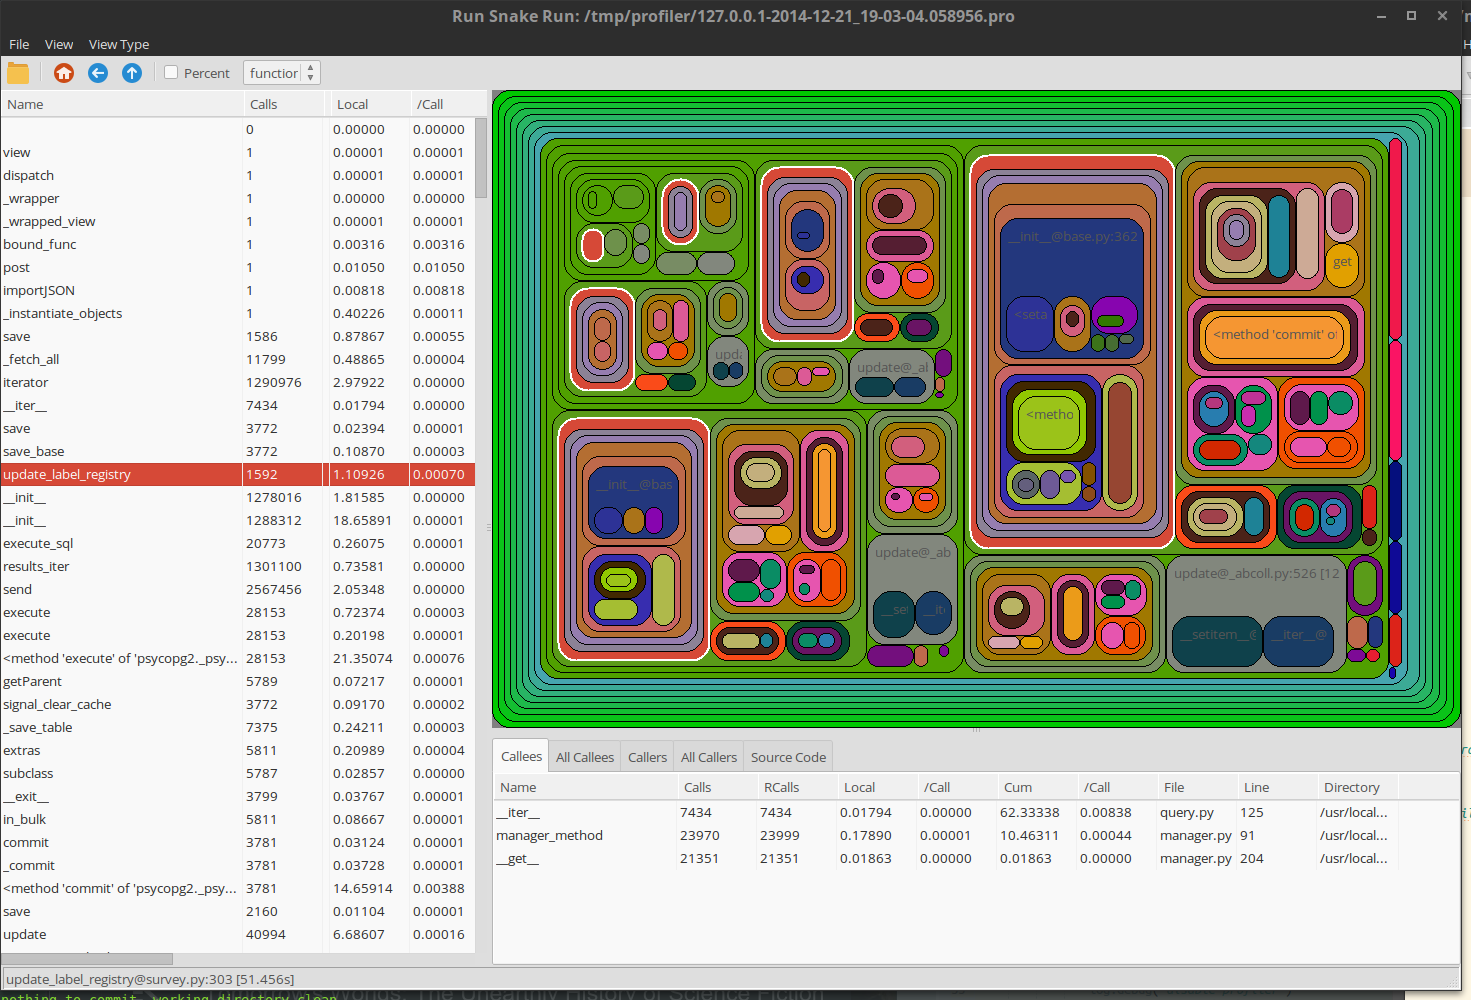
A screenshot of RunSnakeRun visualising a profile made with the django-profiling middleware showing 1592 calls made to update_label_registry during a page request
Once a pain point has been identified, we can go about finding a solution and then adding a test to our suite using python’s mock framework to lock down the number of expected calls.
from mock import patch

@patch.object(Survey,'update_label_registry')
def test_calls_to_update_label_registry_during_import(self, mocked_method):
    """
    Test that a survey import doesn't call
    survey.update_label_registry() too many times
    """
    # Generate a json string to import
    survey = Survey.objects.get(id=1)
    json_string = survey.export()

    # Start testing from here so reset our mock
    mocked_method.reset_mock()

    # Now proceed to import the survey
    Survey.objects.importJSON(json_string)

    # Check the number of calls to our mocked method
    self.assertTrue(mocked_method.called)
    self.assertEquals(mocked_method.call_count, 2)
Template rendering
Django’s template is not known for being particularly fast. This will change in Django 1.8 when it gets Jinja2 support however in the meantime to help investigate problems with your templates, I would recommend installing the django-debug-toolbar-template-timings add on. What we’ve noticed is that the template layer’s performance degrades proportionally to the amount of html content that is being generated and the size of the context object being passed into the templating layer.
One ‘must do’ recommendation for most sites is to enable Django’s built-in cache loader which significantly improves render time with almost no code changes.
Another factor in poor performance is the sheer number of individual templates being rendered. Here the DRY principle is not your friend – a substantial amount of time can be spent simply in the overhead of calling a template with {% include %}. Inlining sub-templates, while painful for a developer to do, has enabled us to half our rendering times for certain pages.
Client side rendering
The final component to a speedy website is fast client-side rendering. This topic is not django-specific, as almost all CSS, JS and HTML performance tips can be applied equally well to django-backed systems. On the BOS2 project we had a lot of problems around the editing interface to surveys. For better or worse, we chose to render the entire survey on a single page when editing. Our surveys can easy become very large and often contains thousands of components such as pages, questions, answer options, action buttons, drop down menus, etc. We were getting reports that for some browsers, simply rendering the content of the page was taking many seconds. The difficulty for us was in trying to replicate the issue so that we could be sure that a implemented fix actually made a difference (it turns out to be quite difficult to replicate a IE6 browser installed on a machine with only 500Mb RAM). In the end we dug deep and uncovered a few ancient laptops with minimal memory in them. Then it was a process of trying various approaches to see which made the most difference. We tried reducing the number of html elements, replacing SVGs with PNGs, various forms of compression, removing whitespace, improving jQuery selections, removing html conditional comments and much more. In the end the solution that gave us the most improvement was reordering the CSS link tags to allow browsers to better parallelise the loading of resources and reduce the need for page reflows.
There are many more areas of a django system that might be causing performance bottlenecks (e.g. server configuration, logging/file access, cache tuning) and on the BOS project we still have a long way to go, but I hope this post has highlighted some tools and tips that can be useful in investigating issues you might have with your own setup.
I’ve also turned this blog post into a slideshare if your interested.